Transforming Bridge & Tunnel Inspections and Emergency Response with inspectX™ and emergencyX™: City of Los Angeles
The City of Los Angeles manages one of the largest and most complex infrastructure networks in the U.S. With over 600 bridges and tunnels, engineering teams must juggle two critical tasks: performing routine bridge & tunnel inspections and ensuring rapid, accurate response after natural disasters, especially earthquakes.
Until recently, both workflows were weighed down by manual processes, fragmented tools, and slow reporting, leaving teams struggling to keep pace.
Agency Snapshot
614 bridges and tunnels under management
367 inspected by Caltrans (FHWA-reportable)
247 inspected internally (non-FHWA)
The Challenge
Routine Inspections: Hours Lost in Paperwork
Before inspectX™, bridge & tunnel inspections were a patchwork of disconnected steps:
Planning: Teams relied on Excel spreadsheets and Google Maps, manually plotting inspection routes.
Data Collection: Inspectors carried Bridge & Tunnel Inspection Reports, cameras, and reference manuals into the field, marking data by hand.
Manual Data Entry: Back at the office, data was re-entered into Access databases, and photos were separately uploaded.
Report Generation: PDF reports were compiled manually, often without photos, and the retrieval of historical inspection or maintenance records was cumbersome.
Each bridge & tunnel inspection took 3.5–7.5 hours, creating a costly drain on resources and slowing decision-making.
Emergency Response: Mapping by Hand
When earthquakes struck, managers would rush to central offices, spread out paper maps, and manually overlay earthquake radii with bridge locations to estimate impacted assets. This slow, error-prone process delayed response when every minute counted.
The Turning Point
To modernize workflows, the city partnered with AssetIntel™ to deploy inspectX™ for inspections and emergencyX™ for emergency response.
inspectX™transformed inspections into a fully digital process:
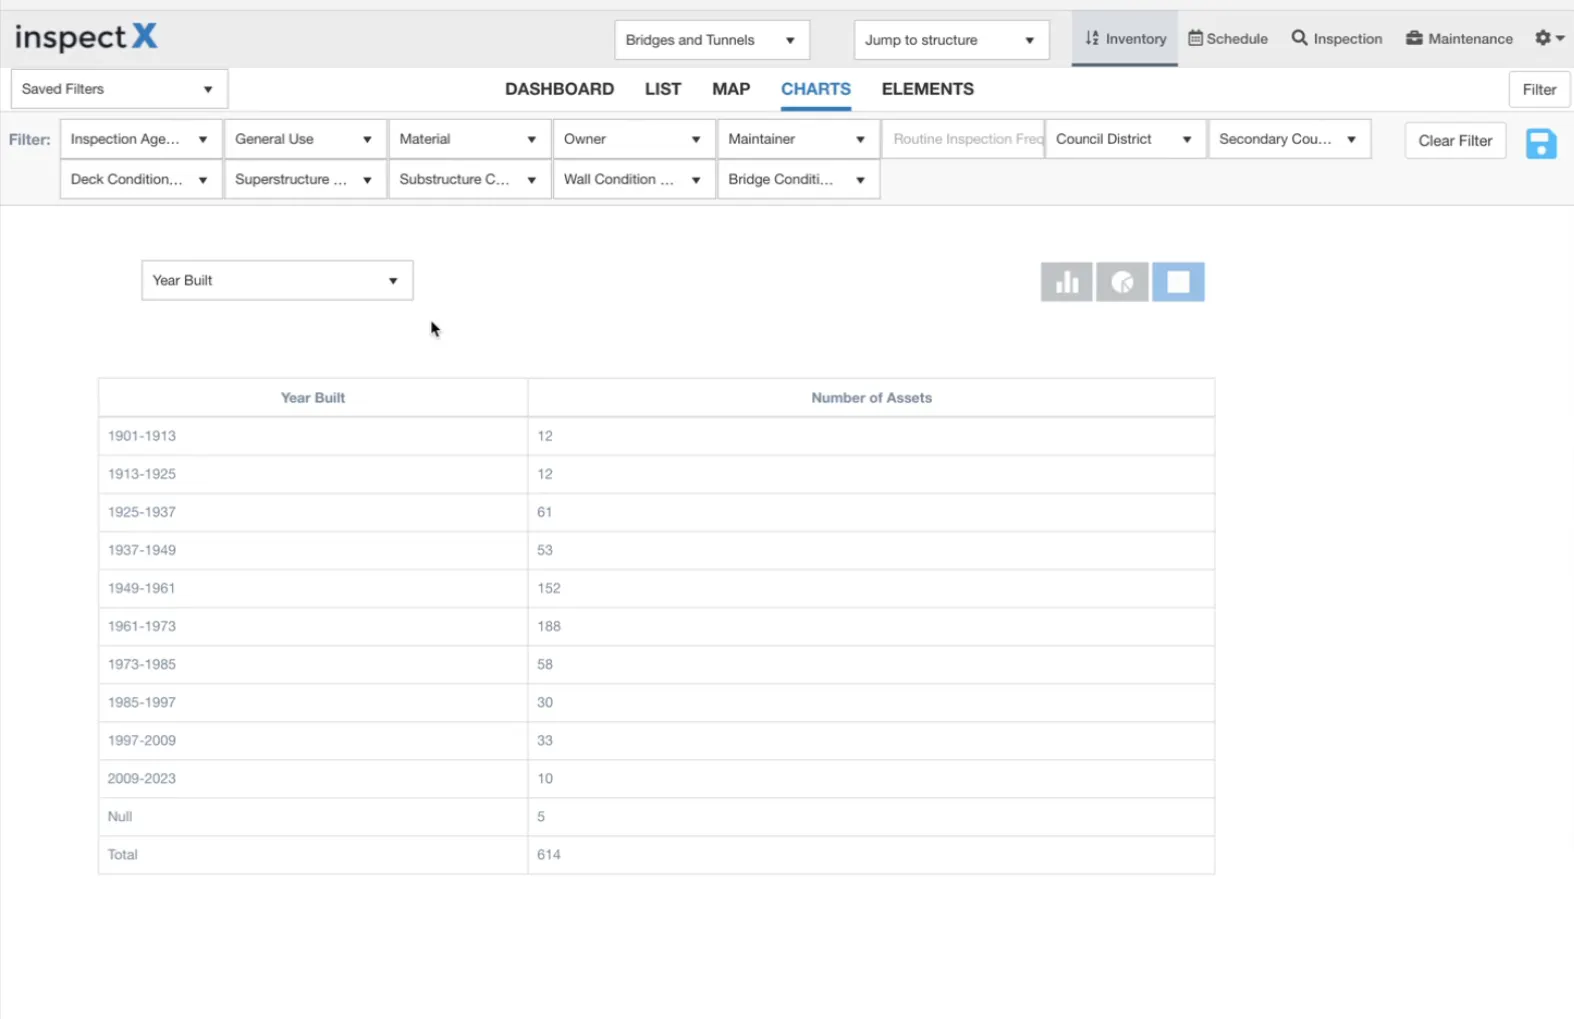
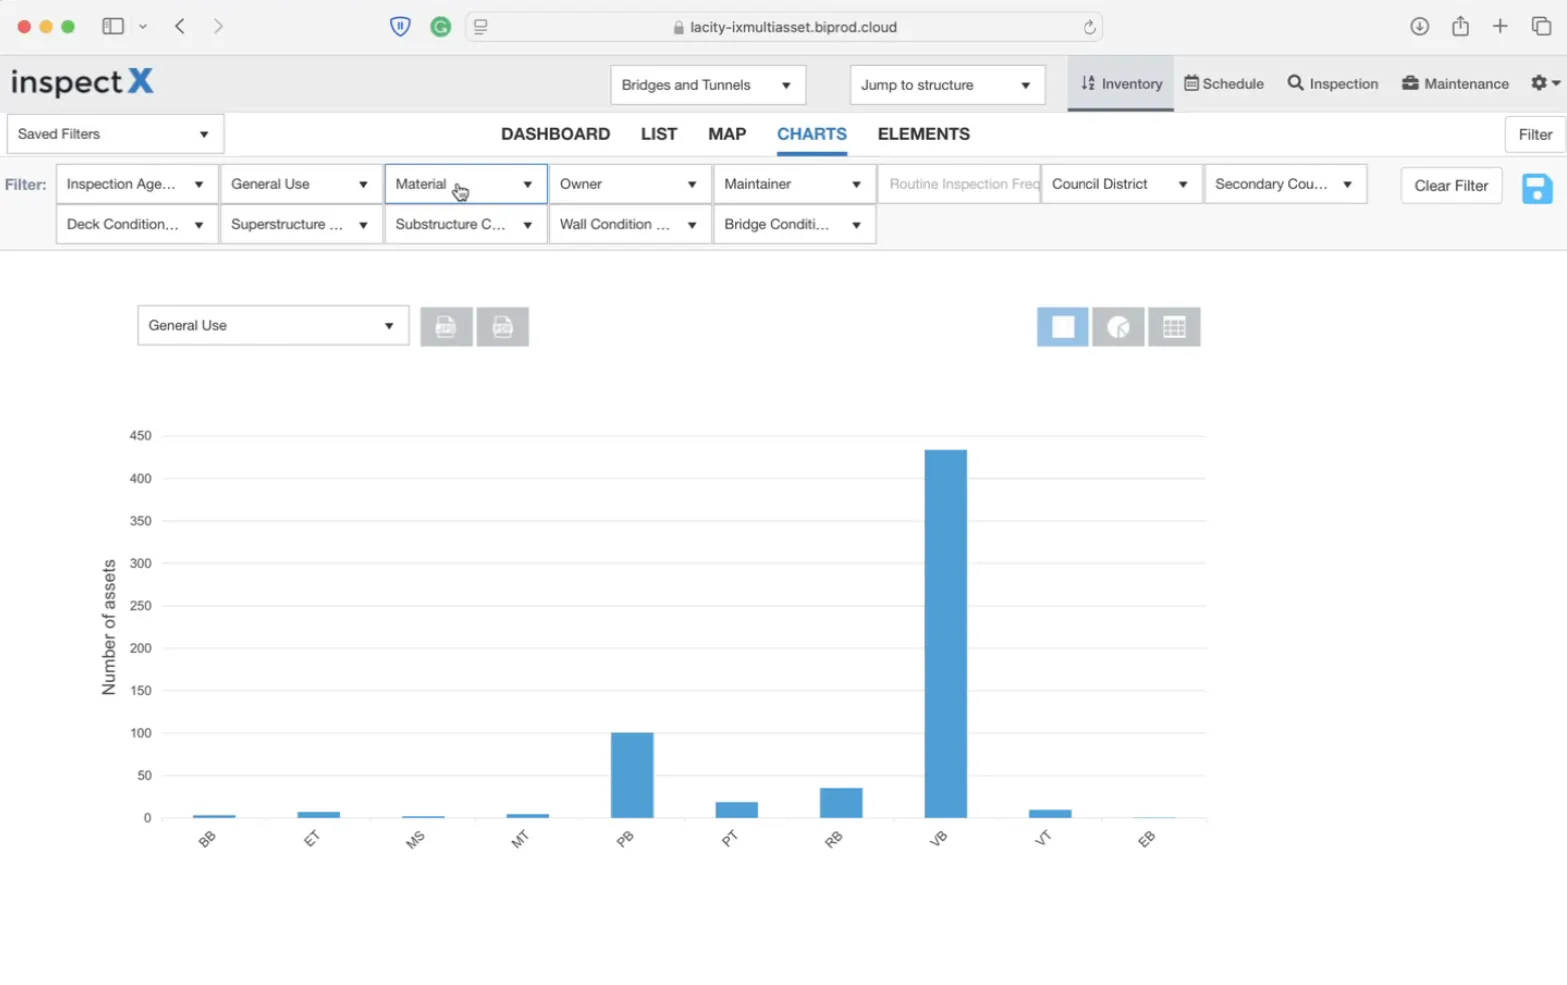
One-stop planning: Managers monitor upcoming and overdue inspections, track all inspection types, and view GIS-powered maps.
Streamlined fieldwork: Inspectors use tablets to access previous inspections, log data, take photos, reference manuals, and record maintenance - all on-site.
Automated reporting: PDFs with embedded photos are generated instantly, eliminating manual data entry.
emergencyX™ revolutionized earthquake response:
ShakeCast alerts feed directly into the system.
Managers instantly know which bridges are in the impact zone.
Follow-up inspections can be assigned in minutes.
Centralized dashboards guide rapid mobilization and resource allocation.
The Results
inspectX™: Faster, Smarter Inspections
Time savings: Inspection duration dropped from 3.5–7.5 hours per bridge to 1.5–2.5 hours.
With ~350 inspections annually, that’s ~875 hours saved each year.
Data accuracy and accessibility: Historical inspection data, maintenance records, and photos are easy to retrieve.
One-stop dashboards: GIS-powered views give managers a full picture of all 614 assets at a glance.
Streamlined reporting: Automated PDFs eliminate duplicate work and manual entry.
Ready to transform your operations? Schedule a consultation today and unlock the full potential of your asset management capabilities with our innovative solutions.
.webp)

.webp)